As an online retailer, you know that managing your inventory levels efficiently is becoming ever more critical to your bottom line.
You can’t afford stockouts, but you also can’t risk tying up your capital in excess inventory. You have to find that Goldilocks “just right” number for each SKU.
One of the best ways to do that is to figure out your optimal inventory to sales ratio.
Your inventory to sales ratio, or I/S ratio, represents the relationship between the capital you’ve allocated to inventory and your total number of sales during a given period.
The lower your I/S ratio, the more efficient you are in allocating capital to inventory. But it can’t be too low, or you’re looking at an increased risk of low inventory or stockouts.
In this post, we’ll look at how to calculate your I/S ratio and compare it with other common inventory management KPIs. We’ll also explore ways to improve your company’s inventory planning so you can protect your profit margin and make sure you always have the right amount in stock.
Managing inventory is no longer just an operational concern.Thisis a capital strategy.
For modern e-commerce brands, inventory sits at the intersection of cash flow, growth velocity, and customer experience. Too much stock ties up capital and erodes margins. Too little stock breaks demand, kills campaigns, and hands revenue to competitors.
This is where the Inventory to Sales Ratio (I/S ratio) becomes critical, and also where it’s most misunderstood.
Most teams treat the I/S ratio as a simple inventory KPI. In reality, it’s a capital efficiency metric disguised as an inventory formula. It tells you how much money your business needs to keep locked in stock to generate revenue. Whether that trade-off is healthy, risky, or wasteful.
In this guide, you’ll learn:
- What the inventory to sales ratio actually measures (and what it doesn’t)
- How to calculate it correctly, with real examples
- What a “good” I/S ratio looks like in e-commerce — and when benchmarks lie
- How to use the ratio strategically, not blindly
- Why ratios alone break down — and how modern demand planning fixes that
What Is the Inventory to Sales Ratio?
The Inventory to Sales Ratio (I/S ratio) measures the relationship between the value of inventory you carry and the sales you generate over a given period.
At its core, it answers a deceptively simple question:
How much capital does your business need to keep invested in inventory to produce revenue?
A Simple Definition of Inventory to Sales Ratio:
The inventory to sales ratio compares your average inventory value to your net sales during the same timeframe.
In plain terms:
- A lower I/S ratio means you generate sales with less capital tied up in inventory.
- A higher I/S ratio means more money is sitting in stock relative to sales.
Neither extreme is inherently good or bad. Only context matters.
This is what makes the I/S ratio powerful: it doesn’t just measure movement. It measures capital efficiency.
Why the Inventory to Sales Ratio Is Not Just an Inventory Metric
Many inventory KPIs focus on speed: how fast products sell, how often inventory turns, how long stock sits in a warehouse. The I/S ratio is different. It focuses on investment intensity.
Two companies can sell the same number of units at the same price and still have radically different I/S ratios depending on how much inventory they carry to support those sales.
That difference shows up directly on the balance sheet in three key indicators: Higher working capital requirements, lower flexibility during demand swings, greater risk when forecasts are wrong.
This is why the I/S ratio matters not just to operations teams, but also reflects on: Finance (cash allocation), growth teams (campaign readiness), leadership (scalability and resilience).
Inventory isn’t just stock. It’s money wearing a SKU label.
Table of contents
- Calculating I/S ratio
- Inventory to sales ratio vs. inventory turnover ratio
- Inventory to sales ratio vs. daily sales of inventory
- How Flieber can help you make better inventory decisions
- Top FAQs about the I/S ratio
|
Inventory to sales |
Inventory turnover |
Daily sales of inventory |
|
|
Definition |
Measures average inventory value compared to net sales. |
Measures how often inventory is sold and replaced over a specific period, typically a year. |
Measures average number of days it takes to sell current inventory. |
|
Use Case |
Indicates how much inventory is on hand relative to sales, helping to assess if you have too much or too little inventory. |
Provides insight into the efficiency of inventory management. |
Helps businesses understand the liquidity of their inventory. |
Calculating your inventory sales ratio
The inventory to sales ratio is simple to calculate. But easy to misinterpret if you stop at the formula.
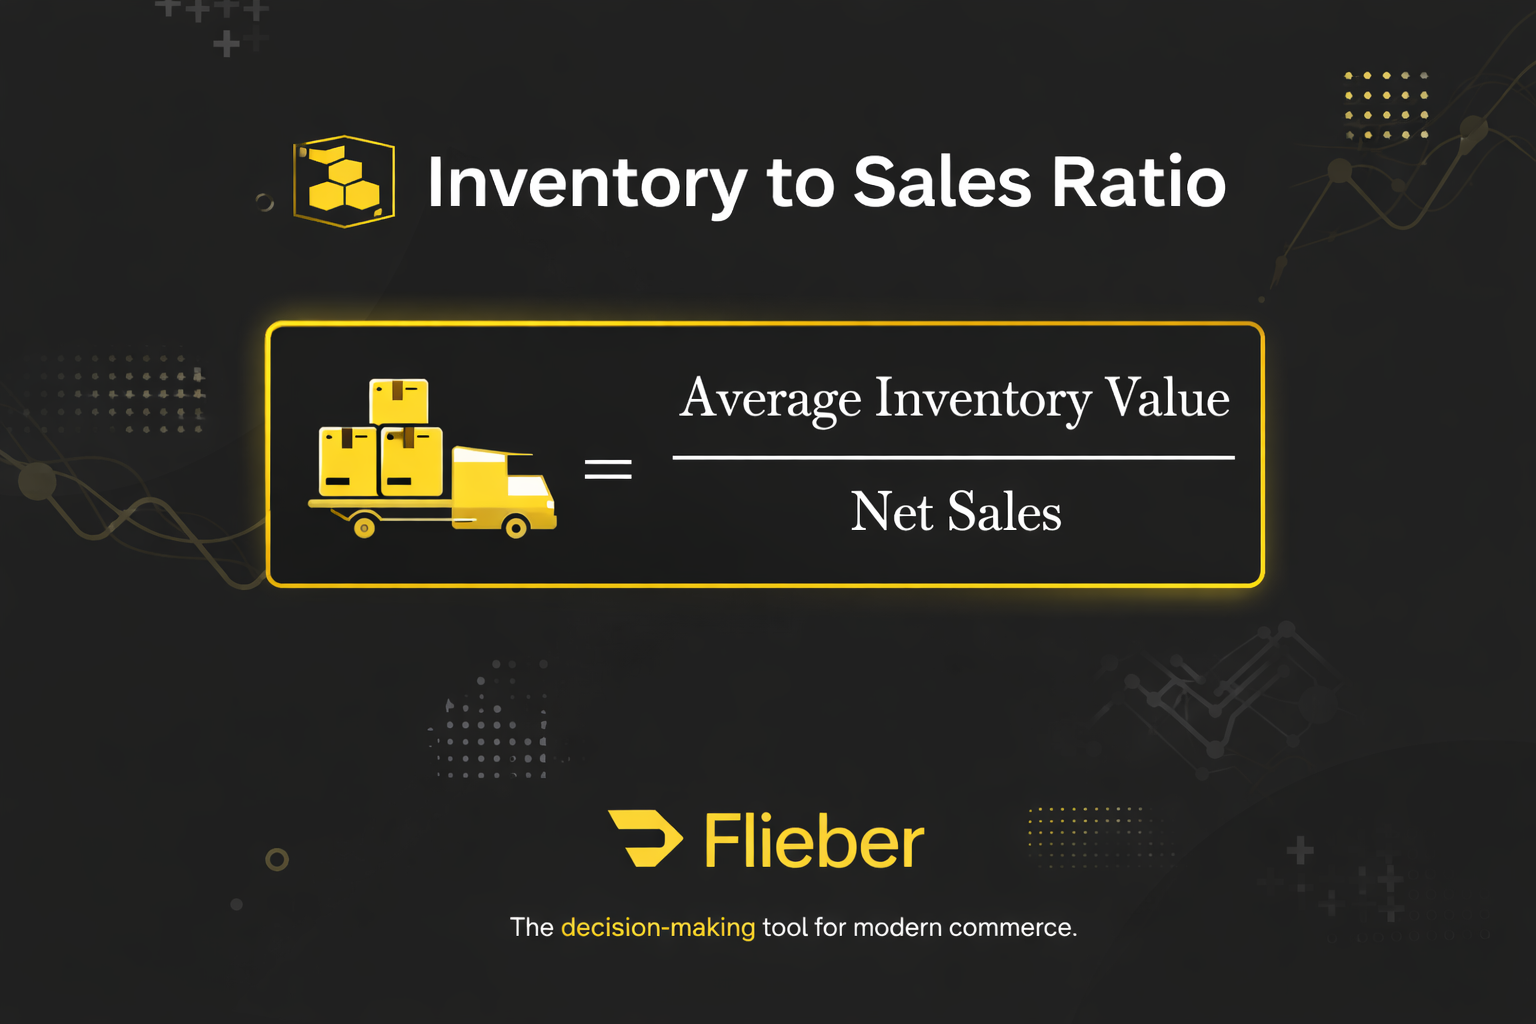
The formula for calculating your I/S ratio is: Average Inventory Value / Net Sales.
Where:
- Average Inventory Value is the mean value of inventory held during the period
- Net Sales is total sales revenue for the same timeframe
That’s it. No advanced math. No forecasting model.
But the insight comes from how you read the result, not from how you calculate it.
Inventory to Sales Ratio Formula
The formula for calculating your I/S ratio is: Average Inventory Value / Net Sales.
To understand how to calculate your I/S ratio, let’s look at two companies, Pyllow and Drybl.
- Pyllow sells ergonomic neck pillows that costs $5 to produce and are sold for $20. During the last 30 days, Pyllow sold 5,000 units, generating $100,000 in sales. In the same 30 days, they carried an average of 5,000 units in inventory, at a total cost of $25,000.
- Drybl sells water purifiers, with the same cost of $5 and sales price of $20. During the last 30 days, Drybl sold the same 5,000 units, generating the same $100,000 in sales. But unlike Pyllow, during this period it carried an average of 10,000 units in inventory, at a total cost of $50,000.
Let’s apply the I/S formula to our two examples:
- For Pyllow, the I/S ratio is $25,000 / $100,000 = 0.25
- For Drybl, the I/S ratio is $50,000 / $100,000 = 0.50
This means that for every $1 sold, Pyllow had 25 cents invested in inventory. On the other hand, Drybl had invested 50 cents for every $1 sold — two times more than Pyllow.
Remember, both companies sell a product with the same cost and the same sales price, and the only variation here was in the inventory level.
Now let’s add a third company, Kalë to the example.
- Kalë sells the supergreen gummies, with the same cost of $5 and sales price of $20. During the last 30 days, Kalë sold the same 5,000 units, generating the same $100,000 in sales. The only difference between Kalë and the previous companies is that Kalë carried an average of 2,500 units in inventory, at a total cost of $12,500.
We’ll apply the same formula of Average Inventory Value / Net Sales:
- For Kalë, the I/S ratio is $12,500 / $100,000 = 0.125
For every $1 sold, Kalë needed only 12.5 cents invested in inventory, which is half of what Pyllow needed and just one-fourth of what Drybl needed.
That might seem great, but here’s the catch: to carry an average of 2,500 units in stock during the month means that its beginning inventory was 5,000 units and ended with 0 units. In other words, Kalë ran out of stock.
The Hidden Risk of “Too Good” Inventory Ratios
An ultra-low I/S ratio often signals underinvestment, not excellence.
When brands push inventory too lean:
- Campaigns can’t scale
- Demand signals get distorted
- Forecasting accuracy collapses
- Revenue volatility increases
The goal is not to minimize inventory at all costs. The goal is to allocate capital where it produces the highest return without breaking demand. That’s the balance the I/S ratio is meant to help you find.
What is the right I/S ratio?
Kalë is a great example of why you shouldn’t aim for the lowest I/S ratio, but the healthiest one.
When it comes to inventory, you should always try to keep the right balance. If you’re overstocked, you are investing more capital than you need to and could even risk ending up with high amounts of dead stock that reduce your profit margins. But if you try to keep that investment as low as possible, you risk being out of stock.
For most growing e-commerce businesses, the right I/S ratio falls somewhere between 0.167 and 0.25.
But a higher number could still be a healthy benchmark if you’re scaling rapidly. It all depends on your industry, rate of growth, and any number of other variables.
Inventory to sales ratio vs. inventory turnover ratio formula
To be clear, your I/S ratio formula is not the same as your inventory turnover ratio formula.
The inventory turnover ratio measures how many times you sell and replace your stock within a given period of time. It’s determined by dividing the cost of goods sold (COGS) by the average value of inventory within a timeframe. It is often, but not always, calculated by year.
The formula for inventory turnover ratio is: COGS / Average Value of Inventory
To break down this formula further:
- COGS = Beginning Inventory + Purchases - Ending Inventory
- Avg Value of Inventory = (Beginning Inventory + Ending Inventory) / 2
The resulting number gives you a sense of how fast your company is moving its inventory. In general, a higher ratio is a good thing — it means you’re making a lot of sales, relative to what you’re spending on inventory.
But in some cases, it could also mean you’re stocking out often, so the inventory turnover ratio is not an ideal measure of inventory efficiency on its own.
To achieve a healthy balance of stock and sales, most e-commerce businesses aim for an inventory turnover ratio between 4 and 6.
For the above example, in a future month Pyllow’s COGS is $22,500 due to purchases of inventory. The average inventory during that same timeframe was valued at $4,500 as they started with $6,000 in inventory and ended with $3,000. With these factors, the inventory turnover ratio would be:
- COGS / Average Value of Inventory = $22,500 / $4,500 = 5
Putting Pyllow’s inventory turnover ratio at 5, an ideal figure for a healthy DTC brand — at least for that particular month.
What’s the functional difference between I/S ratio and inventory turnover ratio?
I/S ratio and inventory turnover ratio are two important ratios with two very different end goals.
Inventory turnover ratio is a solid formula for understanding whether you’re making enough sales and a useful metric in determining whether your business is performing well on the whole.
I/S ratio, on the other hand, is calculated using your net sales values. It gives you a better understanding of how efficient you are at allocating capital to your inventory, with respect to your revenue. Since this is crucial to a healthy balance sheet, your I/S ratio is considered a more straightforward tool for determining how best optimize your company’s sales and inventory.
Both of these formulas are useful guidelines, but neither is particularly handy for the kind of sophisticated demand forecasting more e-commerce businesses need today.
What Is a Good or Bad Inventory to Sales Ratio?
This is the most searched and most misunderstood question about the inventory to sales ratio.
There is no universally “good” I/S ratio.
There is only a healthy ratio given your growth stage, category, and risk tolerance.
Still, benchmarks matter as long as you understand what they represent and when they break down.
General Benchmarks for E-commerce
For most established e-commerce businesses, a healthy inventory to sales ratio typically falls between:
0.167 and 0.25
In practical terms:
- 0.167 → ~$0.17 in inventory per $1 in sales
- 0.25 → ~$0.25 in inventory per $1 in sales
This range usually indicates:
- Reasonable stock coverage
- Acceptable working capital exposure
- Low risk of chronic stockouts
- No excessive buildup of dead inventory
But benchmarks are not targets. They are diagnostics.
A ratio inside this range can still be unhealthy and a ratio outside it can still be strategic.
What Is a Bad Inventory to Sales Ratio?
A bad inventory to sales ratio is any ratio that creates one of these three problems:
- It locks too much capital
- It suppresses revenue
- It makes the business fragile
The number itself is secondary. The impact is what matters.
That said, there are ranges that are usually red flags.
When the Inventory to Sales Ratio Is Too High (Overstock Risk)
Generally bad signal: I/S > 0.35–0.40
An inventory to sales ratio in this range usually indicates that too much capital is being locked into inventory relative to the revenue the business is generating. Instead of inventory acting as a growth enabler, it becomes a financial drag. Products sit longer than expected, tying up cash that could otherwise be reinvested into marketing, product development, or high-velocity SKUs. Over time, this excess stock increases exposure to storage costs, insurance, obsolescence, and write-offs all of which quietly erode margins.
Operationally, this situation is rarely caused by a single mistake. It typically stems from overly conservative forecasts, purchasing decisions driven by fear of stockouts rather than real demand signals, and poor management of lead times. In many cases, the SKU portfolio itself has not been rationalized, allowing slow-moving or low-margin products to absorb a disproportionate share of working capital. Instead of inventory reflecting strategy, it reflects uncertainty.
The business impact compounds quickly. Cash flow tightens as more money sits idle on shelves. Return on invested capital (ROIC) declines because the same revenue now requires a larger capital base to sustain. Margins suffer as excess inventory eventually needs to be discounted or cleared. And perhaps most damaging of all, the company becomes slower to react to market shifts. That makes them less able to respond to new opportunities, demand spikes, or competitive moves because capital is already committed to the wrong stock.
High I/S ratios don’t kill companies fast. They bleed them slowly.
>> LEARN HERE ABOUT OVERSTOCK <<
When the Inventory to Sales Ratio Is Too Low (Stockout Risk)
Generally bad signal: I/S < 0.12–0.15
This is where many teams think they’re efficient, but aren’t.
This is the scenario where many teams believe they are operating efficiently, when in reality they are quietly constraining their own growth. A very low inventory to sales ratio often signals chronic understocking rather than operational excellence. On the surface, the numbers look good: less capital tied up in inventory and seemingly strong efficiency metrics. But beneath that appearance, demand is being suppressed. Products that could sell are simply not available, and the absence of stock distorts the very data used to evaluate performance.
Operationally, this usually happens because inventory decisions are optimized for accounting outcomes instead of real demand behavior. Teams focus on minimizing inventory exposure rather than supporting sales velocity. Marketing and inventory planning operate out of sync, with campaigns launching into limited availability. Lead times are underestimated, and replenishment cycles fail to keep pace with demand. As a result, growth is not limited by market interest, but by product availability.
The business impact is both immediate and long-term. Sales are lost in ways that never appear in reports, because unmet demand leaves no transactional footprint. Customer trust erodes as shoppers encounter out-of-stock messages and turn to competitors. Demand signals become increasingly inaccurate, since stockouts mask true buying intent and corrupt forecasting models. At the same time, customer acquisition costs rise, as advertising spend continues to drive traffic toward products that cannot actually be purchased. What looks like efficiency on paper ultimately becomes a hidden tax on growth.
A low I/S ratio can look great on a spreadsheet and be disastrous in reality.
The Most Dangerous Case: “Looks Good, Feels Bad”
The worst inventory to sales ratio is not necessarily the highest or the lowest. It is the one that appears acceptable on paper but fails in practice. This typically happens when the ratio sits comfortably within industry benchmarks, yet the business still experiences chronic stockouts on its hero SKUs, excess inventory piling up on long-tail products, and volatile revenue from one month to the next. On the surface, nothing looks broken. In reality, the system is misaligned.
This situation usually emerges when the inventory to sales ratio is calculated as a broad average across all SKUs, masking the radically different demand profiles within the catalog. High-velocity products and slow-moving items are blended together, obscuring where capital is actually being misallocated. Growth rates are not factored into planning assumptions, so inventory levels lag behind accelerating demand. And most critically, planning remains static, based on fixed ratios and periodic reviews, rather than dynamic and responsive to real-time changes in demand, lead times, and market conditions.
When this happens, the ratio stops being a diagnostic tool and becomes a false reassurance. It suggests stability while operational friction quietly compounds, leaving the business exposed to both missed revenue and unnecessary inventory risk.
A Simple Rule of Thumb
Instead of asking:
“Is my I/S ratio good or bad?”
Ask:
- Can I scale demand without breaking availability?
- Can I reduce inventory without losing revenue?
- Can I absorb shocks (supplier delays, demand spikes)?
If the answer is no to any of those: Your I/S ratio is bad. Even if it looks “normal.”
The Real Takeaway
- High I/S ratio → capital inefficiency
- Low I/S ratio → revenue suppression
- Healthy I/S ratio → controlled risk + growth readiness
The goal is not to minimize the ratio.
The goal is to optimize it continuously as demand changes.
That’s exactly where static formulas fail and where modern demand planning comes in.
Inventory to sales ratio vs. inventory turnover ratio formula
To be clear, your I/S ratio formula is not the same as your inventory turnover ratio formula.
The inventory turnover ratio measures how many times you sell and replace your stock within a given period of time. It’s determined by dividing the cost of goods sold (COGS) by the average value of inventory within a timeframe. It is often, but not always, calculated by year.
The formula for inventory turnover ratio is: COGS / Average Value of Inventory
To break down this formula further:
- COGS = Beginning Inventory + Purchases - Ending Inventory
- Avg Value of Inventory = (Beginning Inventory + Ending Inventory) / 2
The resulting number gives you a sense of how fast your company is moving its inventory. In general, a higher ratio is a good thing — it means you’re making a lot of sales, relative to what you’re spending on inventory.
But in some cases, it could also mean you’re stocking out often, so the inventory turnover ratio is not an ideal measure of inventory efficiency on its own.
To achieve a healthy balance of stock and sales, most e-commerce businesses aim for an inventory turnover ratio between 4 and 6.
For the above example, in a future month Pyllow’s COGS is $22,500 due to purchases of inventory. The average inventory during that same timeframe was valued at $4,500 as they started with $6,000 in inventory and ended with $3,000. With these factors, the inventory turnover ratio would be:
- COGS / Average Value of Inventory = $22,500 / $4,500 = 5
Putting Pyllow’s inventory turnover ratio at 5, an ideal figure for a healthy DTC brand — at least for that particular month.
What’s the functional difference between I/S ratio and inventory turnover ratio?
I/S ratio and inventory turnover ratio are two important ratios with two very different end goals.
Inventory turnover ratio is a solid formula for understanding whether you’re making enough sales and a useful metric in determining whether your business is performing well on the whole.
I/S ratio, on the other hand, is calculated using your net sales values. It gives you a better understanding of how efficient you are at allocating capital to your inventory, with respect to your revenue. Since this is crucial to a healthy balance sheet, your I/S ratio is considered a more straightforward tool for determining how best optimize your company’s sales and inventory.
Both of these formulas are useful guidelines, but neither is particularly handy for the kind of sophisticated demand forecasting more e-commerce businesses need today.
When a Higher Inventory to Sales Ratio Is Actually Healthy
A higher I/S ratio is not automatically a red flag. In many cases, it’s intentional and necessary. Common scenarios where a higher ratio makes sense:
Rapid growth phases
If demand is accelerating faster than lead times can support, brands intentionally carry more inventory to avoid throttling growth. Here, capital is being converted into speed.
Seasonal or event-driven demand
Brands preparing for Q4, major launches, or promotional spikes often increase inventory well ahead of sales. During these periods, the ratio temporarily inflates by design.
Long or volatile lead times
If suppliers require 90 to 120 days to deliver, maintaining a higher inventory buffer becomes a form of risk management, not inefficiency.
Channel expansion
Launching into new marketplaces or regions requires upfront inventory commitments before sales stabilize.
In all these cases, a higher I/S ratio reflects strategic optionality, not waste.
The mistake is not having a high ratio. The mistake is having one without knowing why.
When a Low Inventory to Sales Ratio Becomes Dangerous
On the other side, aggressively low I/S ratios often hide structural problems.
Warning signs include:
- Frequent stockouts on high-velocity SKUs
- Inconsistent campaign performance
- Sudden spikes in inventory turnover
- Declining customer repeat rates
- Forecast volatility that “looks like demand drops”
A low ratio may feel efficient, but it can quietly:
- Suppress revenue
- Corrupt demand data
- Increase CAC (ads running into low availability)
- Damage long-term trust with customers
Lean inventory only works when demand is predictable and replenishment is fast.
Without that, “efficiency” turns into fragility.
Inventory to Sales Ratio vs Other Inventory KPIs
No inventory metric tells the full story on its own.
The I/S ratio becomes powerful only when understood alongside other KPIs each answering a different question about your operation.
Inventory to Sales Ratio vs Inventory Turnover
These two metrics are often confused, but they serve different purposes.
Inventory Turnover asks: How fast am I selling and replacing inventory?
Inventory to Sales Ratio asks: How much capital do I need to generate sales?
You can have:
- High turnover and poor capital efficiency (if inventory swings wildly)
- Low turnover and a healthy I/S ratio (in slower, high-margin categories)
Turnover measures speed. I/S measures investment intensity.
Both matters but for different decisions.
Inventory to Sales Ratio vs Days Sales of Inventory (DSI)
Days Sales of Inventory (DSI) measures how long inventory sits before it is sold. At its core, it answers a question of liquidity: how quickly inventory can be converted back into cash. This makes DSI particularly useful for identifying slow-moving stock, managing aging inventory, and planning clearance or markdown strategies before products become obsolete.
The inventory to sales ratio, by contrast, answers a different and more strategic question… How exposed your capital is. Rather than focusing on time, it focuses on magnitude. It shows how much money is tied up in inventory to support a given level of sales, which makes it far more relevant for capital planning, growth readiness, and balancing risk versus efficiency.
Inventory to sales ratio vs. daily sales of inventory
Daily Sales Inventory, or DSI, is the average number of time, in days, that it takes to sell all the inventory you have in stock. It’s useful for calculating how long it will take you to clear the inventory you’re currently carrying.
The formula for DSI is: Average Inventory Value / Cost of Goods Sold x 365 days.
While the I/S ratio helps you figure out whether you’re ordering goods in the right quantities, DSI is a measure of the pace at which inventory moves through your company.
With an I/S ratio, you always want to get the lowest possible number without causing costly stockouts. With DSI, numbers can vary widely depending on what industry you’re in.
This is mainly because DSI depends highly on the type of goods sold. For example, perishable goods clear much faster than items like furniture or appliances.
Applying the formula for DSI for Pyllow in the same month for the last example, we’d get:
- Average Inventory Value / Cost of Goods Sold x 365 days
- $4,500 / $22,500 x 365 days = 73
We get a DSI of 73, meaning it takes Pyllow about 73 days to clear all its inventory. A good DSI is usually between 30 and 60 for most industries, so Pyllow could probably stand to carry a bit less inventory throughout the year.
How Flieber can help you make better inventory decisions
Most companies rely on basic formulas like those above, where a few simple equations determine your entire forecast.
Some of the more sophisticated tools or methods may also account for other regularly anticipated fluctuations — like higher Q4 demand — using a percentage you can add or deduct when demand is expected to shift.
The problem is, this kind of inventory planning doesn’t account for all the other variables that impact your sales — like patterns in seasonality, supply chain challenges, shifting trends, or sales boosts due to successful marketing campaigns.
This is because most demand planning systems don’t offer real-time visibility into all the avenues where you sell. They can’t help you navigate when sudden outliers throw your forecasts off-track.
With Flieber’s customizable forecasting and advanced AI algorithms, you get complete visibility into your sales, inventory and supply chain, to help you meet customer demand while minimizing storage costs and stockouts.
You control what you see and can use your forecasts to get as broad or granular as you need, customizing for:
- Predicted growth
- Testing scenarios
- Product comparisons
- Planned marketing events
- Outliers and other variables
With Flieber, you can plan for every scenario with just a few clicks to make sure you always have just the right amount of inventory on hand.
Top FAQs about the I/S ratio
To recap, here are some answers to commonly asked questions about I/S ratio and other key inventory planning formulas.
What is inventory to sales turnover ratio?
When people ask what “inventory to sales turnover ratio” is, they’re typically describing two different inventory planning formulas.
Inventory to sales ratio, or I/S ratio, which represents the ratio of allocated capital to sales volume, and is calculated with the formula:
- I/S ratio = Average Inventory Value / Net Sales
Inventory turnover measures how frequently your inventory turns in a given period. It’s calculated using the formula:
- Inventory turnover ratio = COGS / Average Value of Inventory
For a more in-depth explanation of these formulas, click here to scroll up to the top of this article.
What is the formula for inventory to sales ratio?
The formula for inventory to sales ratio, or I/S ratio, is:
- I/S ratio = Average Inventory Value / Net Sales
Why is the inventory to sales ratio important?
Inventory to sales ratio measures how much stock you need to carry to mitigate the risk of stockouts without allocating too much capital to inventory.
What's a good inventory to sales ratio in e-commerce?
A good inventory to sales ratio in e-commerce is typically between 0.167 and 0.25.
Get more control over your inventory
As an e-commerce leader, you know it takes more than a few simple equations to master your inventory planning.
Flieber is the modern inventory planning platform specifically designed for multichannel retailers with complex product portfolios, lead times, and sales patterns.
Control your inventory, your way. Learn more about how Flieber works by scheduling a demo today