
Table of contents
- What are the main inventory problems for online retailers?
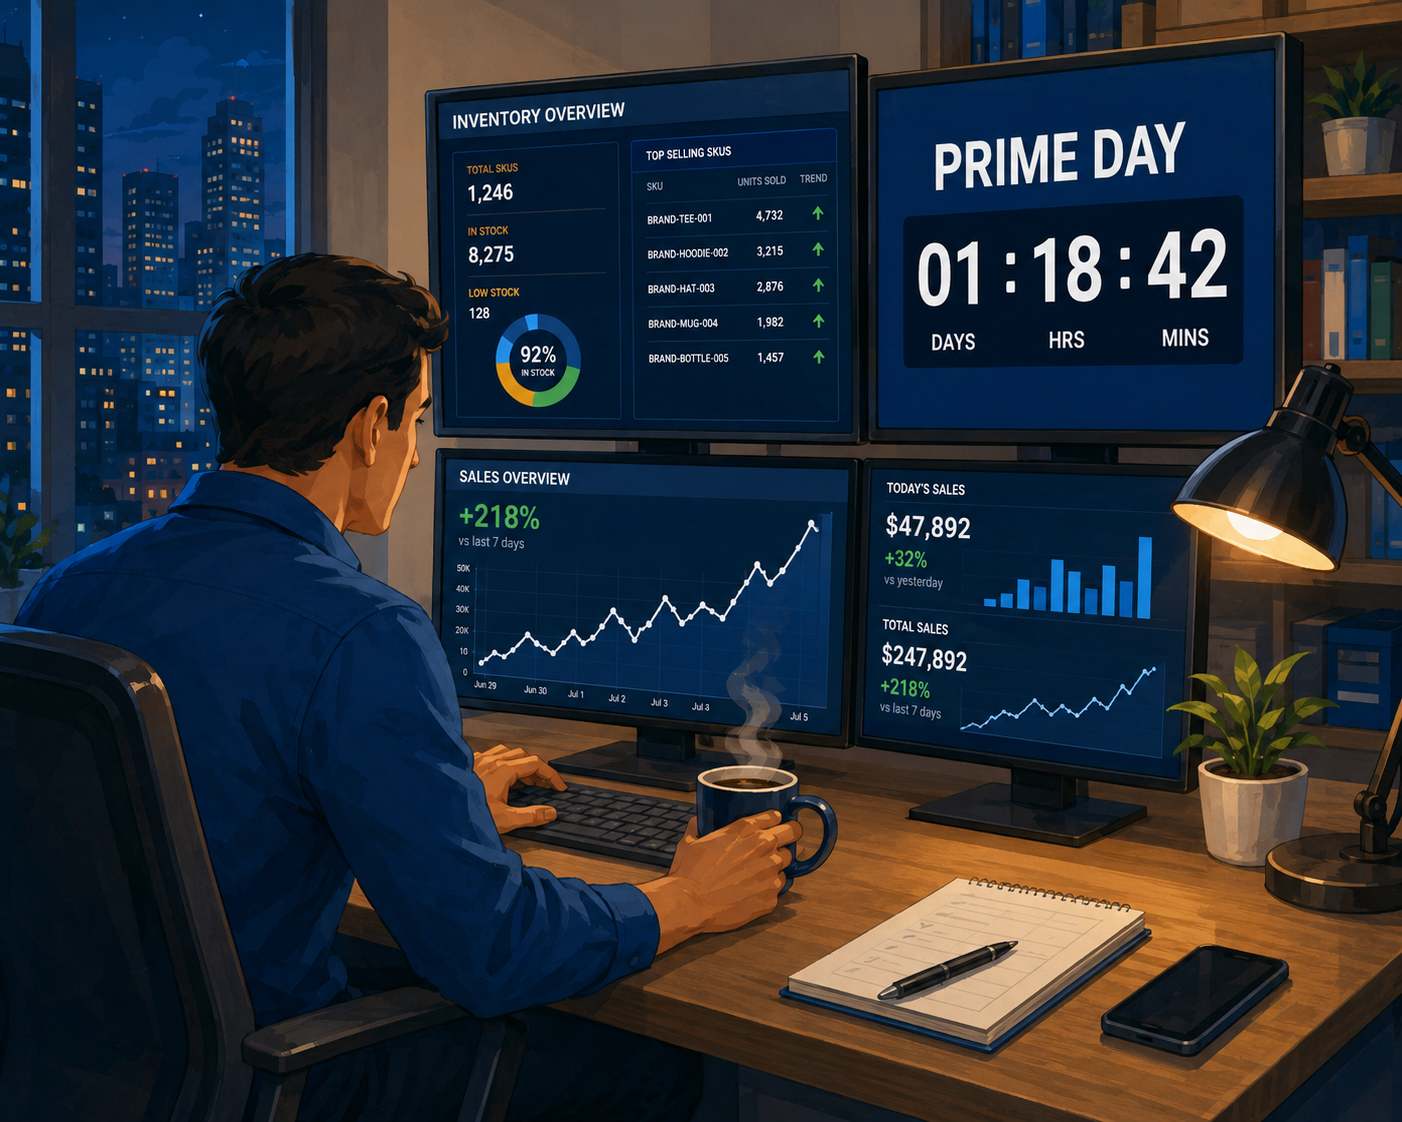
- The harsh reality of poor inventory management
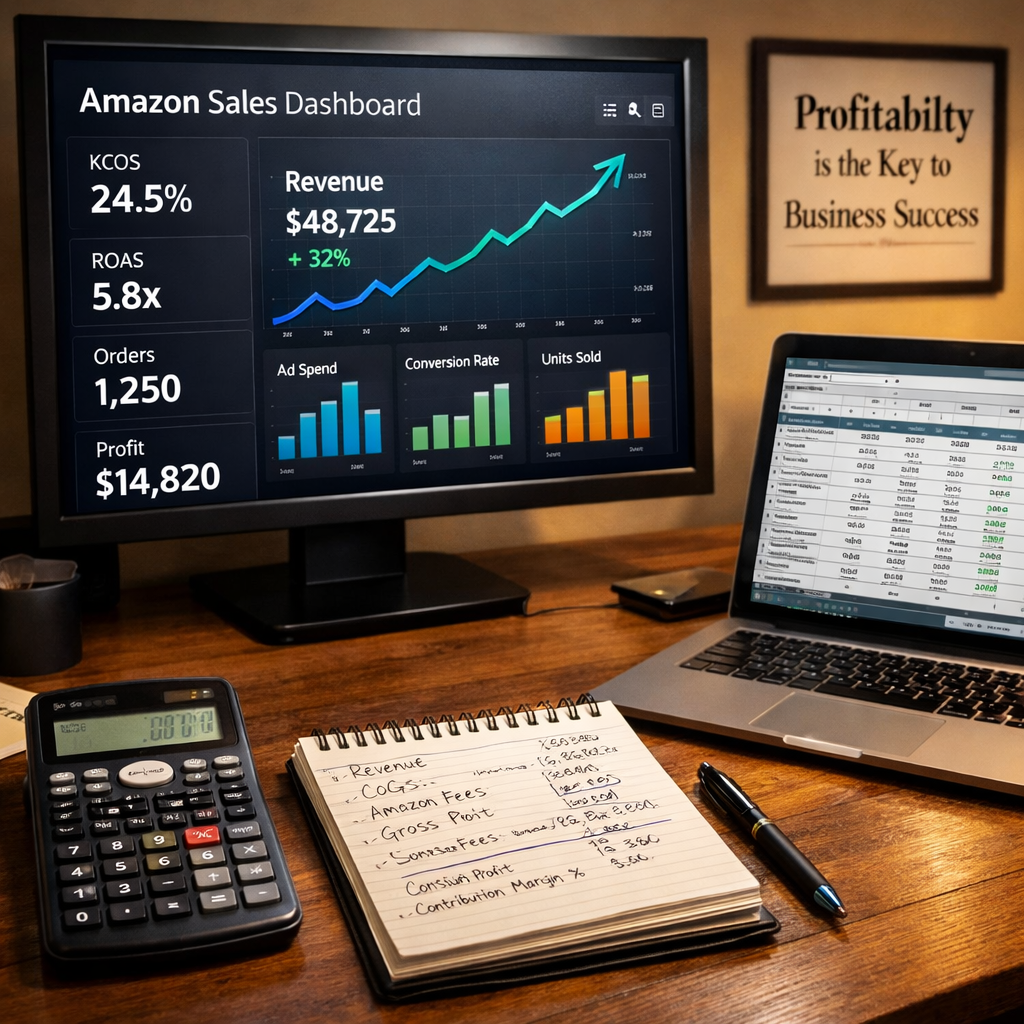
- 6 inventory ROI formulas every platform should have
- How to succeed at inventory optimization long-term
Ah, inventory management. Though we hate to admit it, it’s the one area of the business most ecommerce entrepreneurs would rather not think about.
In fact, roughly 43% of small businesses have zero process for tracking their inventory (not even a manual one). And if we had to guess, we’d say this is probably a big reason some analysts estimate $1.43 locked in stock for every $1 a US retailer makes.
That’s a lot of frozen capital tied up in your inventory. Not to mention the lost sales due to stockouts.
Luckily, complicated inventory processes don’t have to feel like a necessary evil.
With the right platform, you can get your inventory under control, say goodbye to stockouts, and scale your business with ease. 🙌🏽
In this deep dive, we’ll focus on the hard numbers behind poor inventory management and offer some tangible formulas to help you move from passive inventory management to active inventory optimization.
Are stockout and overstock killing your sales? Find out how Flieber can help you get back on track

What are the main inventory problems for online retailers?
Contrary to popular belief, inventory problems don’t usually happen overnight—they build up over time, slowly entangling themselves into your business.
And with one glance at your sales figures, you can clearly see why you need to get ahead of it. But if you’re still juggling multiple SKUs and channels from an Excel spreadsheet, you’re likely spending way too much time without getting the results you want.
Here are a few common causes of online retail inventory headaches:
- Inaccurate forecasts
- Data entry errors
- Partial supply chain visibility
- Poor or incomplete data
Of course, it doesn’t help that most inventory management tools generate forecasts using a rigid set of fixed parameters.
For example, your software might give you a set automation that issues an alert when your stock reaches ‘X’ units—but it can’t proactively warn you when you’re about to go out of stock.
These common mistakes, paired with increasingly complex multi-channel supply chains and ever-shifting FBA limits, can lead you into a vicious cycle of stockouts and lost sales.
Is your inventory forecasting platform letting you down? Schedule a free demo and see Flieber’s accurate forecasting in action.

The harsh reality of poor inventory management
If you’re here, you probably already know that poor inventory management can cause some expensive and hard-to-fix issues.
How expensive, you ask?
Here are some of the biggest (and most cash-draining) consequences of inefficient inventory:
- Costly overstock and stockout: Poor inventory management puts a big dent in your sales thanks to out-of-stock items and extra charges for excess inventory.
- Higher storage fees: Nobody enjoys paying for storage space, but inventory mistakes can increase warehousing requirements and costs—making those little errors even more painful.
- Unpredictable cash flow: Problems in your inventory management process can have a direct impact on your finances, creating trapped capital and major cash flow gaps between when you pay for your stock and when you sell it.
- Lost time: Shuffling between spreadsheets and endless supplier email chains to manage your stock is both draining and inefficient. Worse yet, these small tasks can compound, stealing precious time away from revenue-generating tasks.
- Reputational damage: Inconsistent stock levels can leave your customers disappointed in your brand, prompting them to go elsewhere and even telling their friends to do the same—not to mention the lost sales due to lost rankings.
The good news is, once you know what to look for, you’ll be in a position to select an inventory platform that goes beyond standard “inventory management” to actively optimize your processes and protect your business from the most common ROI killers.

6 inventory ROI formulas every platform should have
Although there are many tools out there that claim to solve inventory problems, very few of them are focused on inventory optimization.
The following formulas will help you break free from the out-of-the-box systems that keep you spinning your wheels with stockouts, so that you can select a true inventory optimization platform for your business.
Formula #1. Inventory Turnover Ratio (ITR)
Inventory Turnover Ratio is one of the most common inventory metrics used in the world of online retail, because it measures the number of times your inventory is sold within a period of time, typically one year.
Here’s why your Inventory Turnover Ratio is important:
- Your ITR can help reveal your store’s movers and reduce the risk of keeping obsolete or expired products.
- It helps establish whether new products are a hit or miss.
- It can assist in spotting trends like cyclicity and seasonality in your products.
Here’s how to calculate your Inventory Turnover Ratio:
Cost of Goods Sold / Average Inventory = Inventory Turnover Ratio
Note: To calculate your Inventory Turnover Ratio, you need to know your Average Inventory. You can calculate it with this formula:
Beginning Inventory + End Inventory / 2 = Average Inventory
Generally, you want to avoid a low ITR as it could mean your product selection, marketing and sales strategies need refinement. Most online retailers normally prefer a high ITR, as this means your store orders goods both often and efficiently (i.e., moving through inventory quickly rather than purchasing a huge pile of stock that takes up space and shrinks slowly).
In action, an Inventory Turnover Ratio could look like this:
- Cost of Goods Sold (COGS): $28,000
- Average Inventory: $10,000
- $28,000 / $10,000 = $2.08
But be careful. You also don’t want an ITR that’s too high, as this could indicate you aren’t ordering enough stock upfront and may be putting your store at risk of stockout.
It’s also worth noting that the ITR focuses on inventory costs only and does not take revenue or profit into account. To build a well-rounded picture, you should consider other metrics alongside your ITR.
Formula #2. Inventory-to-Sales Ratio (I/S Ratio)
The Inventory-to-Sales Ratio (or I/S Ratio) is one of the most misunderstood inventory metrics today. And getting it wrong could mean the difference between your success or failure with inventory planning.
The I/S Ratio represents the relationship between your inventory value and your total sales—it assesses the capital allocated to inventory, compared to the company’s sales volume in a given period. The typical thinking is the lower the I/S Ratio, the more efficient a business is in allocating capital to its inventory.
But when it comes to true inventory optimization, there’s a catch.
For example, let’s say:
Company X sells a product at a cost of 5 dollars and sales price of 20 dollars. During the last 30 days, it sold 5,000 units, generating $100,000 in sales. It carried an average of 2,500 units in inventory, at a total cost of $12,500.
If we apply the I/S Ratio formula:
Cost of Inventory / Sales = I/S Ratio
This means that for Company X, the I/S Ratio is 12,500 divided by 100,000, which equals 0.125.
But here comes the catch. To carry an average of 2,500 units in stock during the month, it means that it started with 5,000 units and ended with 0.
So, while this low I/S ratio might look good on paper, what it really means is that Company X went out-of -stock.
When it comes to inventory, the goal is always to keep the right balance. If you’re overstocked, you’re investing more capital than you need to. On the other hand, if you’re constantly aiming to keep that investment as low as possible, you risk going out-of-stock.
NOTE: While metrics like ITR help you clarify how quickly you churn inventory in a specified timeframe, the inventory-to-sales ratio helps you understand how efficiently you’re allocating cash to stock. Aim to keep your I/S ratio as low as possible for higher margins and lower operational risks. Just be sure to have a plan in place for sudden sales spikes and supply disruptions to avoid stockout.
When it comes to inventory, the goal is always to keep the right balance. If you’re overstocked, you’re investing more capital than you need to. On the other hand, if you’re constantly aiming to keep that investment as low as possible, you risk going out of stock.
Need a more balanced inventory strategy? Find out how Flieber’s machine learning algorithms can help you free up more capital, without going out-of-stock.
Formula #3. Gross Margin Return On Inventory (GMROI)
Your GMROI shows how much margin your business generates for every dollar spent on inventory. It assesses your business’ ability to sell merchandise and produce cash that exceeds inventory costs, while offering a birds’ eye view of your inventory health.
For example, say you sell womenswear, menswear and childrenswear. GMROI allows you to look at each department’s performance separately.
Here’s why your GMROI matters:
- GMROI allows you to look at product performance from a department or product level so you can pinpoint the root cause of stock issues.
- It determines product performance to affirm or reject product choices.
- You can use GMROI data to plan future product releases with greater accuracy.
Here’s the GMROI formula:
Gross Margin / Average Inventory x 100 = GMROI
Aim for a higher GMROI as it shows each stock piece is producing more profits, whereas a number below 100% indicates your product/department is losing money.
In action the GMROI could look like this:
- Gross Margin: $100,000
- Average Inventory: $37,000
- $100,000 / $37,000 x 100 = 270.27%
When searching for an inventory solution, choose an optimization platform that gives you a detailed portfolio-level view of your product performance.
Once you’re able to see which products have the healthiest margins, you can free up working capital trapped in overstocked SKUs and use those funds to fuel more sales of your most profitable products.
Formula #4. Days Inventory Outstanding (DIO)
Your DIO, also known as Days in Inventory (DII) or Days Sales of Inventory (DSI), tells you the typical number of days your store takes to sell its inventory. It also shows how many days of merchandise you have left.
Here’s why DIO is important:
- It gives you solid grounds for making restock decisions.
- You can avoid low stock numbers and stockout by keeping a keen eye on inventory numbers.
- It keeps you efficient in inventory spending.
Here’s the DIO formula:
(1 / Inventory Turnover Ratio) x 365
In action, DIO could look like this:
- Inventory Turnover Ratio = 9.79
- (1 / 9.79) x 365 = 37 days
While DIO is a great metric to track, many inventory management systems are built to be overreliant on it.
Instead, look for an inventory optimization platform that blends longer-term forecasts with data-crunching AI to account for a broad range of factors, such as seasonality, rank influence and price variation—all of which can have a big impact on your sales pace at certain times throughout the year.
Don’t get stuck in a stockout cycle. Grab your free Flieber demo today and find out how to strike the perfect balance between sales and inventory.
Formula #5. Inventory Holding Cost
Your Inventory Holding Cost tells you how much you’re really spending on warehousing, and takes into account the cost of owning and storing items. You express Inventory Holding Cost as a percentage, and it consists of four parts:
- Stock Service Cost
- Inventory Risk Charge
- Capital Cost
- Storage Space Fee
Here’s why you should care about Inventory Holding Cost:
- It tells you how long you can hold stock before it becomes unprofitable.
- It clarifies the true cost of holding stock in your business.
- It highlights how much stock you need on hand to maintain optimal inventory levels.
Here’s the formula to calculate Inventory Holding Cost:
Inventory Holding Amount / Inventory Value x 100 = Inventory Holding Cost
Note: Inventory Holding Amount = Inventory Risk Charge + Inventory Service Cost + Storage Fee + Capital Cost
Here’s how Inventory Holding Cost can look in action:
- Inventory Holding Amount: $20,000
- Inventory Value: $80,000
- $20,000 / $80,000 = $0.25
- 0.25 x 100 = 25%
Formula #6. Inventory Sell-Through Rate
Your inventory Sell-Through Rate tells you how much inventory you’ve sold in a particular time period (typically 30 days) compared to how much stock is received from your supplier. The Sell-Through Rate’s main job is to help you establish how quickly you can sell a product, and how good a fit a certain product is for your customers.
Because the Sell-Through Rate is a portfolio analysis index, it helps you quickly identify the top and bottom performers at the individual product level.
Here’s the formula to calculate your Inventory Sell-Through Rate:
Number of units sold / Number of units received x 100
In play, your Inventory Sell-Through Rate could look like this:
- Units sold in January: 930
- Units received in January: 1200
- 930 / 1200 x 100 = 75%
Aim to keep your Inventory Sell-Through Rate as high as possible because this indicates the item has high sales velocity and is popular amongst your customers. Conversely, a low Inventory Sell-Through Rate could signal a poor market fit, poor item quality (especially if returns are high), or insufficient marketing.

While understanding the right inventory ROI formulas can certainly go a long way in helping you select a true inventory optimization platform for your business, it’s important to remember that no forecast is 100%.
Like most things growth-related, inventory is a moving target. And your forecasts are only as good as the data and tools you use to calculate them.
Flieber uses machine learning to analyze five years of data patterns from over 400,000 products to help take your inventory beyond baseline ‘management’ processes to reach true optimization. Our AI accounts for essential factors like seasonality, rank influence, price variation and more to achieve an 80.1% accuracy rate for a 60-90 day period.
That’s 40% more accurate than most platforms, and it’s all done for you automatically. No messy spreadsheets or multiple screens required.
Ready for real inventory optimization? Get a fresh start with Flieber.