.png)

There’s a reason Excel is the go-to forecasting tool for countless brands and merchants. It’s flexible, affordable, and you already know how to use it.
If you have a small product portfolio and are focused on a few key regions and channels, you’ll have no problem forecasting your sales and inventory from one simple spreadsheet. But once you start expanding, the process can quickly become quite complex.
If you’re one of the many retailers looking to increase sales across multiple product lines and sales channels next year, should you stick with Excel for your forecasting? Or is now the time to explore tools that can support more complex use cases?
Let’s take a closer look at the pros and cons of forecasting in Excel so you can choose the process that works for you.
Forecasting in Excel: the pros and cons
If you’re here, you already know the low cost, easy access, and relatively short learning curve are some of the key benefits of forecasting in Excel, Google Sheets, or any other spreadsheet-based tool. And the pros don’t end there.
Inventory planners love Excel because it’s:
- Free and easy to get started
- Flexible and can adapt to multiple models
- Already got a few models built-in
But what about the cons?
As great as Excel is, it's still a generalist tool. That means any advanced analysis can require a high amount of resources to build and run. Say, for example, if you need an ABCD or Inventory Availability over time analysis – you will need to spend considerable time building it yourself.
Excel also can’t preprocess your data for things like lost sales substitutions, trends and seasonality identification, and outlier removal. Instead, you’ll need to add and adjust your historical data manually.
In the beginning, that’s simple enough. But when working with a range of product lines across multiple channels and regions, it can become a massive task. 10 products becomes 100 forecasts. 100 products becomes 1,000 forecasts. At this stage, the task of forecasting doesn’t just grow — it compounds.
With manual data entry, comes out-of-date data. This lag in accurate sales data can make the decision making process less precise, resulting in costly stockouts or overstocks. And of course, the more data you enter, the more bloated the spreadsheet becomes. In this environment, even minor errors can have devastating results — especially with multiple people making changes to one spreadsheet.
Finally, Excel doesn’t include machine learning, which means it can’t be trained to optimize your forecast accuracy. With AI playing a larger role in inventory planning, this may leave you struggling to keep up with competitors using advanced tools.
Inventory forecasting in Excel: Key models and limitations
Most Excel-based data forecasting methods rely on one of a few basic types of calculations. Within each category, there may also be a number of different equations you can use to develop more complex predictions.
Some of these formulas are available as built-in Excel forecast functions (specifically for newer versions like Excel 2016 and after), while others may require more advanced programming or mathematical expertise.
Here are the three main forecasting models most inventory planners use in Excel:
1. Moving average
A moving average is a simple statistical formula that takes a series of averages from different samples of a data set. The “moving” (also sometimes referred to as “running” or “rolling”) comes from the way the formula makes its way along a graph, analyzing a new subset of data each time it's used.
In inventory planning, moving averages are often used to calculate the average amount sold between a specific start and end date, like over the last 30, 60, or 90 days. Also called time series data, this historical data from each timeline range is used to make predictions about future sales.
- Benefit: One benefit to moving averages is that they help smooth out short-term fluctuations in sales data, making it easier to track trends and patterns. For example, in retail, they help plannes create models that give them a better general idea of how a product is performing.
- Limitations: There are various limitations to using moving averages to generate predicted values. For one, moving averages do not apply seasonality. A moving average could demonstrate a steady upward or downward trend, when the actual pattern is cyclical in nature. It also doesn’t account for the vast multitude of variables that could be affecting sales performance for each and every SKU.
Calculating accurate moving averages also requires saving extensive historical sales data and ensuring the accuracy of that data. This kind of data can be expensive or impractical to access, or simply non-existent for DTCs with a limited sales history.
This amount of data can also overwhelm an Excel forecast sheet, causing it to slow down or freeze.
While you can use an Excel template to run these calculations for you, you still need to handle the data entry, which means there are no real-time updates and human error is a constant risk.
2. Exponential smoothing
Like moving averages, exponential smoothing relies on historical data to make future predictions. But in exponential smoothing, older observations are given less weight in forecasting than newer data. The advantage of this is that more recent trends factor more heavily into forecast values.
Exponential smoothing can also do a better job than a moving average of identifying seasonal patterns and confidence intervals. More sophisticated exponential smoothing models, like the Holt-Winters model, are capable of interpreting and eliminating random anomalies and outliers in historical data.
For instance, if your sales data includes low-in-stock inventory or past stockouts, some forecasting methods may view this as a seasonal pattern rather than an outlier, leading to poor replenishment decisions and potentially more stockouts.
Exponential smoothing formulas can account for this by recognizing the difference between patterns and anomalies, improving the accuracy of your forecast data.
- Benefits: Depending on which model is used, exponential smoothing can be an effective sales forecasting technique for businesses whose sales follow predictable seasonal patterns and gradual trends.
- Limitations: There are several different models for making exponential smoothing calculations. Simpler models can’t account for all the variables that impact demand forecasting accuracy.
Exponential smoothing models need constant updating and re-calibration to account for new sales trends, patterns, and irregularities. Choosing the wrong model could lead to wildly inaccurate predictions.
Exponential smoothing can also be sensitive to outliers and may not react well to sudden changes in data. It tends to be biased toward assuming past patterns will always be indicative of future trends.
Excel offers several options for automating exponential smoothing, but the forecaster needs to choose the right formulas and add the right parameters to ensure accuracy.
To use exponential smoothing effectively, you will likely need a dedicated person on your team with solid knowledge of forecast statistics and data analysis methods. Plus the time and resources to continuously keep Excel worksheets up to date.
3. Linear regression
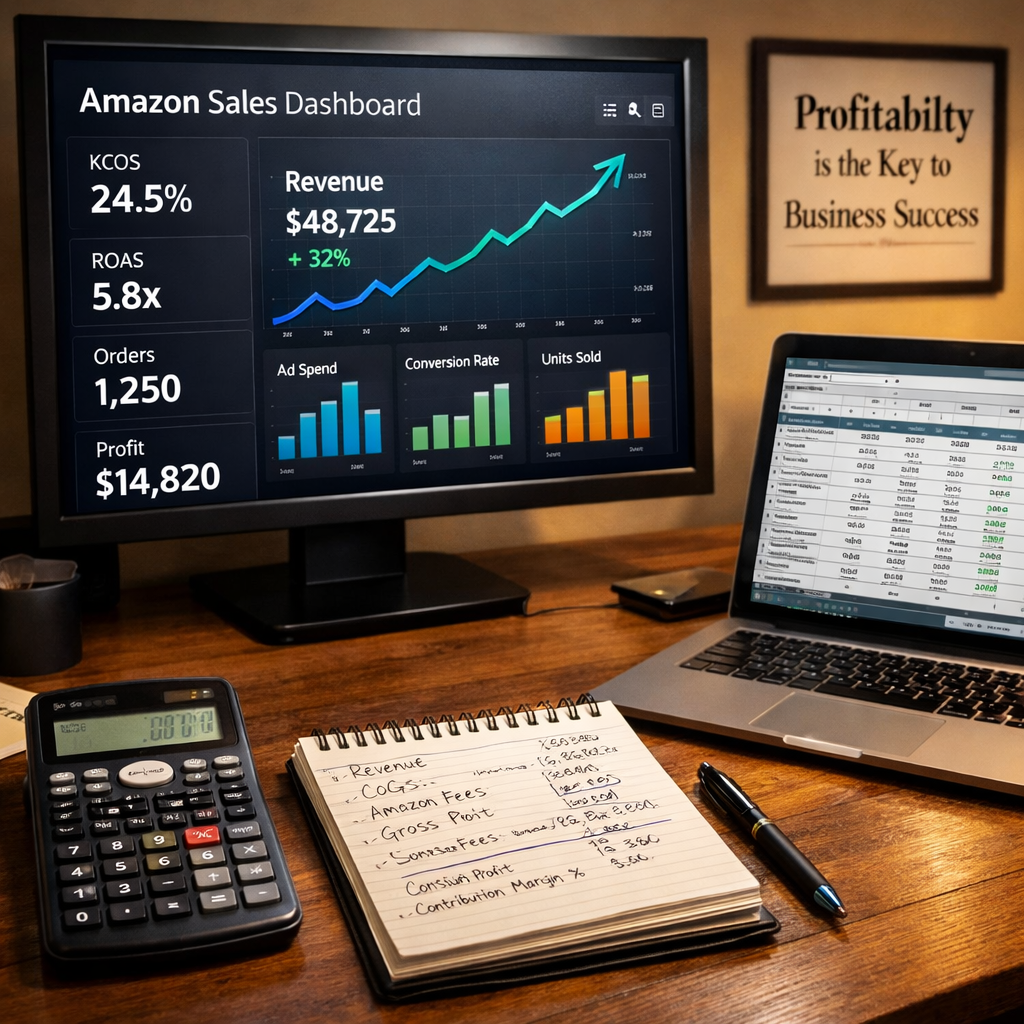
Linear regression is used to spot correlations between different variables in sales data and make predictions based on those relationships. For instance, it can be used to create a line chart that shows how your ad spend has historically affected your sales and predict how it might do so in the future.
You can also use trendlines modeled with linear regression to study how prices, competition, promotion, and seasonality impact your sales and demand. Or you can use linear regression to make other business decisions, like whether and when to launch a new product, based on linear trends.
- Benefit: Compared to other sales forecasting formulas, linear regression is relatively simple. It can also be used to study the relationships between multiple variables at a time.
- Limitation: Linear regression is more vulnerable to distortion than some other models. This means that outliers and noise can easily render models unreliable. Data must be carefully aggregated, cleaned, and pre-processed for duplicates, errors, and anomalies.
Running a linear regression analysis in Excel is a simple yet time-consuming process. Excel doesn’t have built-in tools for advanced uses of linear regression, like weighted linear regression, or the ability to give some factors or relationships more importance than others.
Using these equations in Excel may require additional programming skills, or a lot of time watching online tutorials.
Flieber gives you a better way to forecast
With an Excel spreadsheet, you’re responsible for manually selecting formulas, and inputting and formatting every new data point as it comes in.
As hard as you may try, your calculations may never truly take every sale into account.
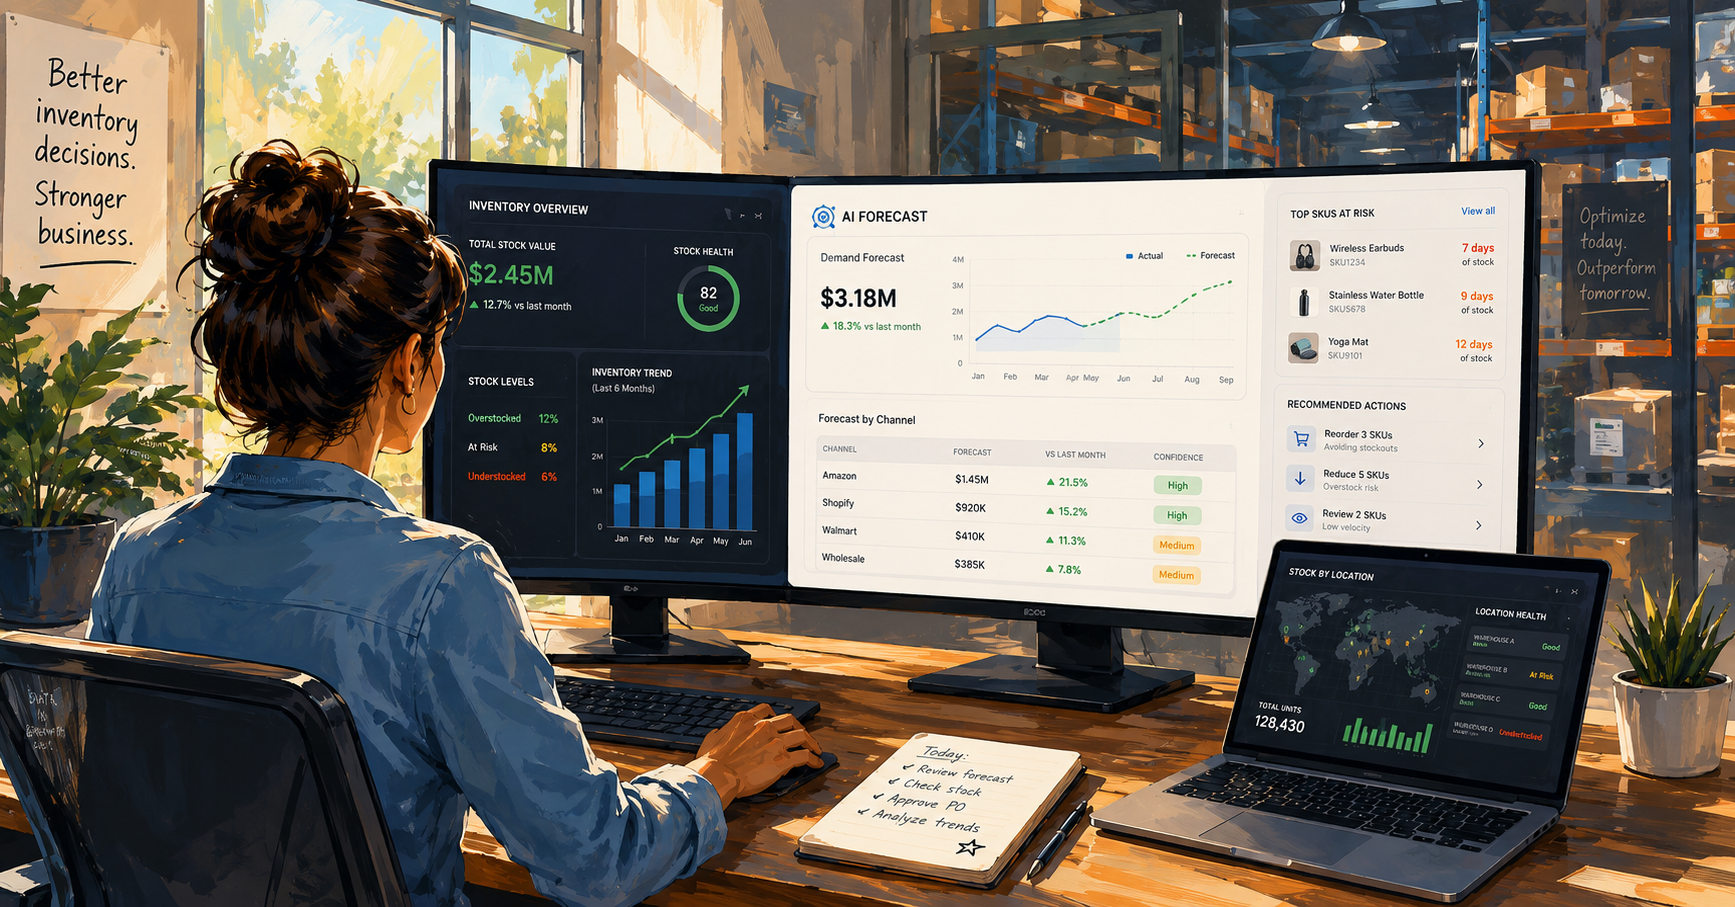
Unlike Excel, Flieber uses machine learning algorithms to forecast future demand using your real-time sales data. Even as your products and sales channels expand, your forecast accuracy improves.
With Flieber, you get:
- Seamless integration so you can natively connect with Amazon and Shopify for real-time data updates
- Smart recommendations based on up-to-the-minute sales data
- Full visibility into sales and forecast data at both a SKU and category level
- Customizable forecasts including a variety of forecasting models where you can apply seasonality and make manual adjustments as needed
- Easy data export so you can integrate your forecasts seamlessly into your inventory planning spreadsheets
Excel forecasting is great for what it does. But it simply isn’t fit to handle the complexities of modern, multichannel e-commerce. When you’re scaling at speed, Flieber enables data-driven decision-making — without the need for tedious data-entry, formula updates, and error correction.
A sales and inventory platform that gives you real control
The more channels you add and the bigger your brand grows, the higher the likelihood of costly human errors.
While Excel may give you the illusion of your control, Flieber gives you actual control over your inventory. Flieber’s advanced forecasting tools can help take the growing pains out of complex, inventory planning
Learn more about Flieber’s latest sales forecasting platform, Flieber Sales. Or, get started for free if you’re a brand selling more than $1 million USD on Amazon and/or Shopify.