Every product you sell either moves your business closer to profit, or quietly drains it. Contribution margin is the metric that tells you which is which. If you've ever wondered what is contribution margin and why finance teams obsess over it, this guide breaks it down with plain language, real formulas, and ecommerce examples you can apply today.
Defining Contribution Margin
Contribution margin is the revenue left over after subtracting all variable costs associated with producing and selling a product. In other words, it's the portion of each sale that actually contributes to covering your fixed costs and eventually, to generating profit.
To define contribution margin in the simplest possible terms: it's what remains when you remove what you spent to make that specific sale happen.
It does not include rent, salaries, or software subscriptions. Those are fixed costs that exist regardless of how many units you sell. Contribution margin focuses only on the costs that scale with your volume.
The Contribution Margin Formula
There are three versions of the formula depending on what you need to measure:
Unit Contribution Margin
Unit CM = Selling Price per Unit − Variable Costs per Unit
Example: You sell a skincare kit for $80. Your variable costs (product cost, shipping, packaging, payment processing fee) total $35.
Unit CM = $80 − $35 = $45
Each unit sold contributes $45 toward your fixed costs and profit.
Total Contribution Margin
Total CM = Total Revenue − Total Variable Costs
Example: You sell 500 units of that kit in a month.
Total CM = (500 × $80) − (500 × $35) = $40,000 − $17,500 = $22,500
Contribution Margin Ratio (CM Ratio)

This means 56.25% of every dollar in revenue is available to cover fixed costs and generate profit. The CM ratio is especially useful when comparing products with very different price points.
What Counts as a Variable Cost?
Variable costs are expenses that change directly with production or sales volume. For ecommerce businesses, these typically include:
- Cost of Goods Sold (COGS): The purchase price or manufacturing cost of the product
- Outbound shipping: What you pay to ship each order to the customer
- Packaging materials: Boxes, tape, inserts, labels
- Payment processing fees: Typically 2–3% of the transaction value
- Marketplace fees: Amazon FBA fees, Shopify payments, etc.
- Variable fulfillment costs: Per-order pick and pack fees if you use a 3PL
- Returns processing costs: If they vary by unit sold
Fixed costs like warehouse rent, full-time staff salaries, and SaaS subscriptions are excluded from contribution margin calculations.
Contribution Margin vs. Gross Profit Margin
These two metrics are often confused, but they measure different things. The key distinction is which costs are included.
|
Contribution Margin |
Gross Profit Margin |
|
|
Subtracts |
Variable costs only |
COGS (fixed + variable production costs) |
|
Best used for |
Product-level decisions, pricing, mix analysis |
Overall business profitability |
|
Includes fixed manufacturing costs? |
No |
Yes |
|
Formula basis |
Per unit or total revenue |
Total revenue |
|
Most useful when |
Deciding what to sell more of |
Reporting to investors or stakeholders |
In practice: A product can have a healthy gross profit margin but a low contribution margin if its variable selling costs (shipping, ads, returns) are high. This is extremely common in ecommerce and one of the main reasons DTC brands run out of cash despite "strong sales."
Why Contribution Margin Matters for Ecommerce and Inventory Planning
Understanding contribution margin becomes especially critical when you manage multiple SKUs. Here's why:
It exposes which products are actually profitable
Gross margin treats all SKUs the same. Contribution margin doesn't. A bulky, low-priced item with high shipping costs may look profitable on paper until you isolate its variable costs. CM forces that conversation.
It drives smarter inventory decisions
When you know the contribution margin per unit, you can prioritize which SKUs to reorder, promote, or discontinue based on actual financial impact. Not just revenue or units sold. A product with a 15% CM ratio is not worth tying up $50,000 in inventory the same way a 55% CM ratio product is.
It enables break-even analysis
Once you know your Total CM, you can calculate how many units, or how much revenue you need to cover your fixed costs:

Example: If your monthly fixed costs are $15,000 and your unit CM is $45:

This number is actionable. It tells your team exactly what sales volume must hit before the business is profitable in a given period.
It informs pricing strategy
If you're considering a promotional discount, CM analysis tells you the exact volume increase needed to maintain the same total contribution. Dropping price by 20% without understanding your CM can turn a profitable campaign into a loss.
Contribution Margin Limitations
Contribution margin is powerful but not perfect. Keep these limitations in mind:
- It doesn't account for fixed costs: A product with a high CM ratio still doesn't guarantee profitability if your fixed cost base is too high.
- Classifying costs correctly is harder than it looks: Some costs (like warehouse labor) have fixed and variable components, creating gray areas.
- It ignores long-term strategic value: A low-CM product might anchor a customer relationship that drives high-CM repeat purchases. Pure CM analysis would flag it as a problem.
- CM ratios vary by channel: The same product sold on your website vs. a marketplace can have very different contribution margins due to fee structures. Always segment by channel when making decisions.
Contribution Margin in Practice in 3 scenarios
Scenario 1: Choosing which SKU to restock with limited cash
Your team has $20,000 to reinvest in inventory and two products are running low. Product A sells for $60 with variable costs of $38 — unit CM of $22 (37%). Product B sells for $90 with variable costs of $42 — unit CM of $48 (53%).
On revenue alone, both look attractive. But on contribution margin, Product B returns $48 per unit versus $22. Every dollar you put into Product B does more work. With $20,000, restocking Product B generates roughly $10,700 in potential contribution, versus $5,800 for Product A. The decision stops being a debate.
This is exactly where contribution margin earns its place in inventory planning: it makes capital allocation decisions objective.
Scenario 2: Running a 20% promotional discount
Your marketing team proposes a sitewide 20% off campaign to drive volume. Before approving, run the numbers. Take a product priced at $80 with variable costs of $35 — unit CM is $45, or 56.25%.
After the 20% discount, the new price is $64. Variable costs stay at $35. New unit CM drops to $29 — a 35% reduction in contribution per unit. To break even on total contribution, you now need to sell 55% more units just to match what you were already generating.
If your historical data doesn't support that kind of volume lift, the campaign destroys margin. Contribution margin analysis turns a gut-feel decision into a testable hypothesis before you commit the budget.
Scenario 3: Evaluating a new sales channel
A marketplace partner offers you distribution but charges a 22% platform fee on every sale. Your product sells for $100. Variable costs before the fee: $38. Current direct-channel unit CM: $62 (62%).
On the marketplace: revenue net of fee is $78. Variable costs remain $38. New unit CM: $40. This is a 35% drop.
That's not necessarily a dealbreaker, but it changes the conversation. At $40 CM per unit, how many units does the channel need to move to justify the operational complexity? Does the incremental volume offset the margin compression? Contribution margin gives your team a shared number to reason around. Instead of debating whether the channel "feels right."
Contribution margin is one of those metrics that looks simple on the surface but has deep operational implications the moment you start applying it across a real product catalog. For ecommerce businesses managing dozens or hundreds of SKUs, tracking CM at the product level, not just at the business level. This is what separates teams that scale profitably from those that grow themselves into a cash flow crisis.
Stop Running Contribution Margin Decisions on Incomplete Data
The three scenarios above only work if the numbers feeding them are accurate. Unit CM by SKU. Variable costs by channel. Inventory levels by warehouse. When that data lives across spreadsheets, ERPs, and channel dashboards. Updated manually, versioned inconsistently, and the decision is only as good as whoever last touched the file.
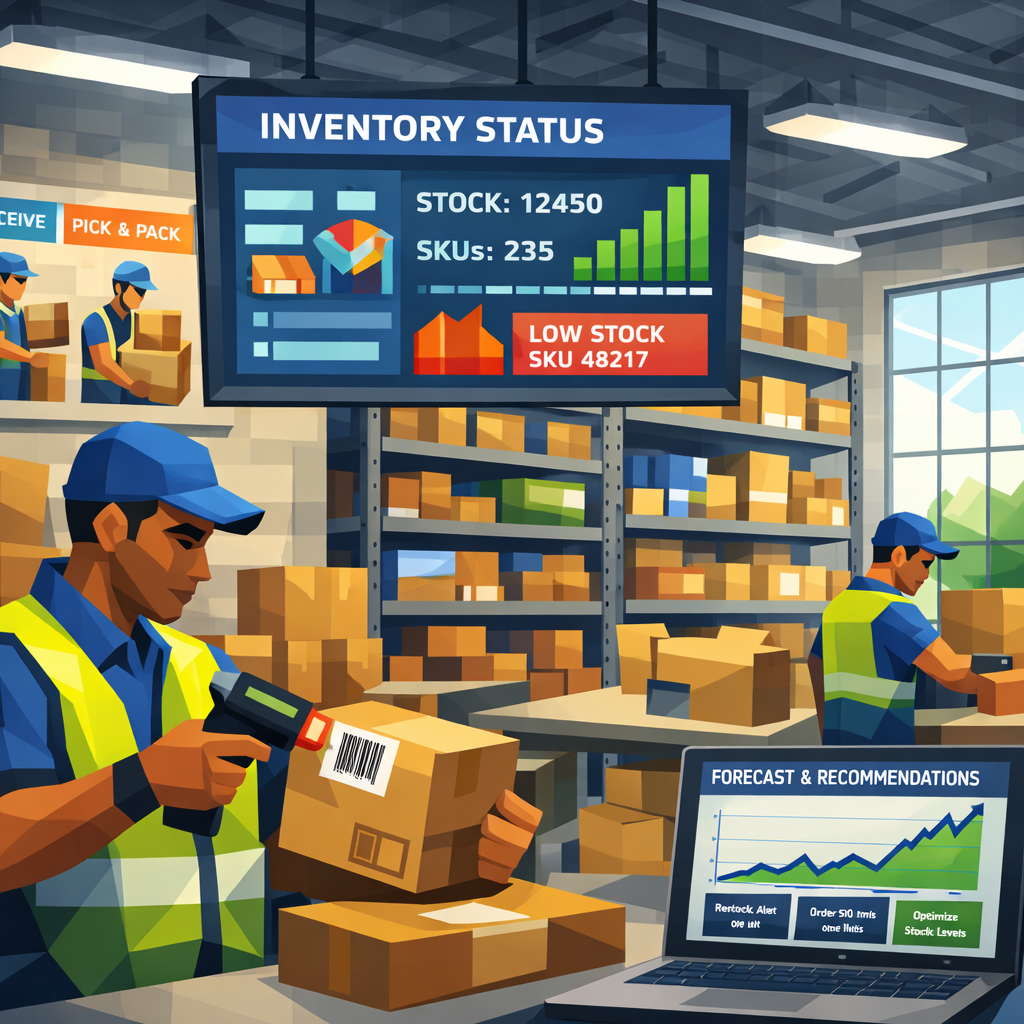
Flieber connects your sales, inventory, and channel data into a single planning layer, so contribution margin analysis stops being a one-off exercise and becomes a live signal. When demand shifts, Flieber surfaces which SKUs are trending toward stockout or excess before the outcome locks in, giving you time to act on the restock decision, not just react to it.
Flieber customers average a 62% reduction in stockouts and a 17% reduction in overstock, directly improving the contribution margin of every SKU in the catalog.
See how Flieber turns your inventory data into contribution margin clarity. Book a Demo