Inventory turnover ratio in ecommerce operations measures how many times inventory is sold and replaced over a given period. It indicates how efficiently inventory is being converted into sales relative to the amount of stock held.
1. What it is (Definition)
Inventory Turnover Ratio (often shortened to inventory turnover) is a metric that measures how many times inventory is sold and replaced over a given period. In ecommerce operations, it indicates how efficiently inventory is converted into sales relative to the amount of stock held.
At a conceptual level, inventory turnover reflects inventory velocity. A higher turnover means inventory is moving quickly through the business, while a lower turnover means inventory is sitting longer before being sold. The ratio connects sales activity with inventory investment, making it one of the most important indicators of operational efficiency.
Inventory turnover is not a performance goal on its own. It is a diagnostic metric. A high turnover can signal strong demand and lean inventory, but it can also indicate understocking and stockout risk. A low turnover may reflect overstock, weak demand, or misaligned purchasing decisions.
For ecommerce brands, inventory turnover provides a time-compressed view of how well inventory planning, replenishment, and execution are working together.
2. Who it’s for
Inventory turnover ratio is especially relevant for mid-market ecommerce brands and aggregators operating between $5M and $100M in annual revenue. At this scale, inventory represents a large share of working capital, and efficiency differences materially affect cash flow.
Shopify-based ecommerce businesses use inventory turnover to evaluate whether purchasing decisions align with actual sales behavior. As SKU counts increase, turnover helps identify products that are tying up cash without contributing proportionally to revenue.
Amazon and Walmart third-party sellers closely monitor turnover because marketplace storage costs and performance incentives penalize slow-moving inventory. Low turnover often correlates with higher fees and restricted flexibility, while excessively high turnover can increase stockout risk.
Multichannel ecommerce teams rely on inventory turnover to assess overall inventory health across channels. It provides a single lens to evaluate whether total inventory investment is appropriate relative to total demand, even when sales are fragmented across platforms.
Inventory turnover becomes more meaningful as volume grows. For very small brands, volatility can distort the metric, but at mid-market scale it becomes a reliable signal of inventory efficiency.
3. How it works
Inventory turnover compares sales activity over a period to the average inventory held during that same period. While it is often calculated using cost of goods sold and average inventory value, the operational interpretation matters more than the formula.
A turnover ratio of “X” means that, on average, the business sells through its entire inventory X times within the period. This can be translated into time-based intuition: higher turnover corresponds to shorter inventory holding periods, while lower turnover corresponds to longer holding periods.
In practice, teams analyze inventory turnover at multiple levels. At an aggregate level, it shows whether total inventory investment is aligned with overall demand. At the SKU or category level, it reveals which products are moving efficiently and which are accumulating.
Inventory turnover is influenced by multiple operational levers: demand planning accuracy, order quantities, replenishment timing, lead times, and stock allocation. Changes in any of these inputs will affect turnover over time.
Because turnover is backward-looking, it is most useful when tracked consistently and compared against internal trends rather than treated as a one-off result.
4. Key metrics
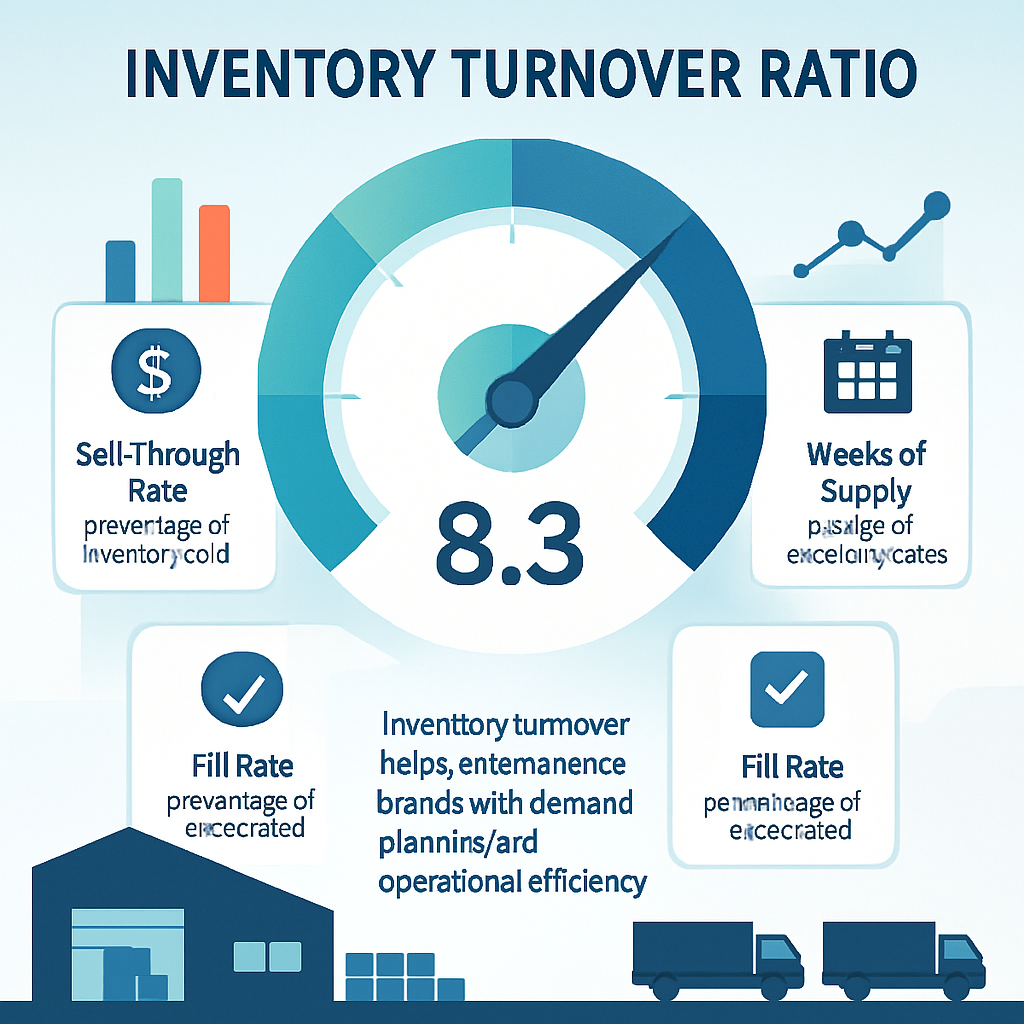
Inventory turnover is the focal metric, but it must be interpreted alongside complementary measures to avoid misleading conclusions.
Sell-through rate provides context on how much of the inventory received actually sold within a given period. A low turnover paired with low sell-through typically indicates overbuying or weak demand. High sell-through with high turnover may signal lean inventory and potential stockout risk.
Weeks of supply is the time-based counterpart to inventory turnover. Lower weeks of supply generally correspond to higher turnover, while higher weeks of supply indicate lower turnover. Tracking both helps teams understand inventory coverage in more intuitive terms.
Fill rate adds the service-level perspective. A business may achieve high inventory turnover by holding minimal inventory, but if fill rate declines, the turnover improvement may be coming at the expense of customer availability.
Together, these metrics form a balanced view. Inventory turnover shows efficiency, sell-through shows demand alignment, weeks of supply shows risk and coverage, and fill rate shows customer impact.
5. FAQ
Is a higher inventory turnover always better?
No. Extremely high turnover can indicate understocking and increased stockout risk, even if efficiency appears strong.
How does inventory turnover affect cash flow?
Higher turnover generally frees up cash by reducing how long capital is tied up in inventory.
Should inventory turnover be tracked by SKU?
Yes. SKU-level turnover helps identify slow-moving items that may be dragging down overall performance.
How often should inventory turnover be reviewed?
It is typically reviewed monthly or quarterly, alongside other inventory performance metrics.
Can promotions distort inventory turnover?
Yes. Short-term promotions can temporarily increase turnover without reflecting sustainable demand patterns.