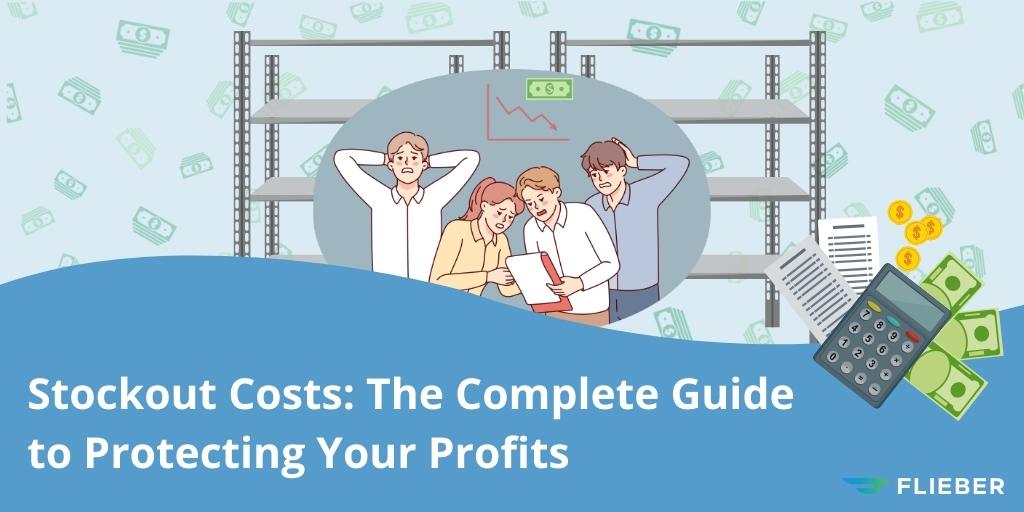

According to a study from the IHL Group, inventory distortion (i.e., stockouts and overstocks) will cost retailers nearly $1.8 trillion in 2023. That’s roughly the size of Brazil’s entire GDP.
The impact of stockouts on customer satisfaction can be devastating for modern commerce brands. In 2022, more than half of global e-shoppers reported being unable to purchase products due to stockouts.
According to one McKinsey survey, 71% of consumers said they switched brands or retailers when they couldn’t find their desired product in stock. Only 13% stayed brand-loyal, and waited for the item to be back in stock.
Clearly, the old adage still holds true: stockouts really do cause walkouts — including virtual ones.
But stockouts are avoidable. In this guide, we’ll show you how to calculate your stockout costs and protect your profits by improving your demand forecasting and inventory planning.
Table of contents
- What are stockout costs?
- How to calculate the real cost of stockouts
- The top 4 causes of stockouts
- Key inventory management concepts
- How to avoid stockouts
What are stockout costs?
Stockout costs refer mainly to the capital you lose when your customers want — but can’t purchase — your inventory. Direct stockout costs are the lost sales you would have made if the desired item had been in stock at the time of purchase.
However, stockouts also incur many indirect costs, such as the cost of expedited replenishment from your suppliers, increased customer service costs, loss of potential customers, and the long-term impact on your brand reputation.
How to calculate the real cost of stockouts
To calculate the direct cost of stockouts, use the following formula:
Cost of Stockout
= Number of Days Out of Stock x Average Units Sold Per Day x Price Per Unit
For example, let's say you’re a well-known DTC that sells upmarket soy candles for $50 each. You sell an average of 150 candles a day, and you’ll be out of stock for 5 days.
In this case, you would calculate your stockout costs as:
5 days x 150 candles x $50 per candle = $37,500
That's a loss of nearly $40,000 in lost sales due to just five days of stockouts. Unfortunately, the cost of stockouts rarely stops there.
There are also many other indirect costs you may incur, such as:
- Refunds due to canceled orders
- Discounts and incentives to prevent churn
- Negative reviews leading to decreased brand reputation
- Difficulty to attract new customers
- Cost of expedited shipping
- Adding or switching suppliers or order fulfillment providers
- Lower product rankings and reduced visibility
- Cost of a quick-fix backorder solutions
- Tighter capacity limits with Amazon FBA
- Increased administrative and customer service costs
Both the direct and indirect costs of a stockout can also lead to future costs, including:
- Marketing and advertising to rebuild your brand’s image and recover lost rankings
- Lost sales due to lack of capital for seasonal product launches
- Increased carrying costs due to reduced sales velocity across your product portfolio
No matter how healthy your bottom line, the combined real and opportunity cost of a stockout adds up to a price that is more than most businesses can afford.
Let’s take a closer look at the main causes of stockouts and how to avoid them.
The top 4 causes of stockouts
1. Inaccurate demand planning
Research has shown that around 70-75% of stockouts are caused by flawed ordering and replenishment practices. These can include:
- Ordering too few products or placing orders too late
- Not ordering enough inventory ahead of seasonal events like Black Friday
- Misinterpreting patterns and anomalies in sales data
These errors usually happen when retailers use dated or inefficient manual methods, like Excel spreadsheets, for their demand planning. Manual forecasting methods are labor-intensive, time-consuming, and prone to human error.
When used to make predictive calculations, these estimates typically rely on a basic Inventory to Sales Ratio (I/S ratio) or other over-simplified inventory formulas that only account for one or two variables within your sales data.
2. Sudden spikes in demand
Some stockouts are caused by sudden spikes in customer demand. These spikes may be due to predictable factors, like the launch of a new marketing campaign. Or they may be entirely unforeseen, such as unanticipated port closures in your DTC supply chain.
Sudden spikes in demand may be caused by:
- An unforeseen viral trend: For example, if your company was selling buckets when the Ice Bucket Challenge went viral.
- A natural disaster or weather event: For example, if you sell miniature fans and there is an unexpected heatwave.
Even if you’re confident in your safety stock levels, without the right planning, a sudden surge in demand could wipe out your inventory.
3. Supply chain disruptions
Despite taking most of the media fallout for most stockouts in recent years, supply chain disruptions aren’t actually to blame for the majority of stockouts. However, since they get the most attention — and can cause some of the longest delays — it’s important to make sure that your supply chain factors heavily into your inventory management.
Here are some key supply chain management risks to be aware of:
- Labor shortages and disputes, especially those that threaten to keep products from getting to you or keep last-mile shipping carriers from delivering them to your customers
- Raw materials or component shortages that make it difficult or impossible to source vital pieces of your finished product
- Wars, weather disasters, politically-motivated trade legislation and other crises that block your goods from getting where they need to be
AI isn’t quite sophisticated enough yet to accurately predict the next canal obstruction or geopolitical conflict. But having a clear and agile inventory system — with diverse suppliers and transportation — can help you stay resilient even in the worst-case scenario.
4. Cash flow issues
Sometimes the cause of stockouts is at once the simplest to explain and the toughest to resolve. For many modern commerce brands, not enough working capital to replenish your inventory can quickly lead to stockouts.
Without a healthy balance of working capital, you risk:
- Running out of inventory and not having the funds to replenish
- Relying on unpredictable, underperforming suppliers
- A self-perpetuating cycle of customer dissatisfaction that leads to more stockouts and less brand credibility
To maintain optimal inventory levels moving forward, the goal is to have enough cash on hand to invest in the right inventory at the right time, while avoiding a loss of working capital due to excess inventory and dead stock.
Key inventory management concepts to help you stay in stock
To avoid stockouts, no matter what the cause, you need a robust plan backed by clean inventory data.
Here are some key concepts to think about as you start building out a more resilient inventory management system:
|
Sales Forecasting |
How much of a particular SKU is likely to sell based on its history, and considering all past constraints? |
|
Demand Forecasting |
How much would my customers be willing to buy if my product didn’t have any constraints? |
|
Demand Planning |
How much do I project my customers will buy from my product based on the constraints I project to have in the future, including capital available, supplier disruptions, etc.? |
|
Inventory Planning |
When should I restock, how much should I order, and where should I send it in order to fulfill the demand I have planned? |
|
Supply Chain Operations |
What should I do to make sure my inventory plan will happen in reality? |
Note that some of these terms are often used interchangeably by retailers, solutions providers, and/or e-commerce experts and journalists to describe one singular, key concept:
Making sure you always have the right amount of stock to meet customer needs, minimize costs, and maximize profits.
How to avoid stockouts: 5 steps toward optimal inventory control
Now that we’re clear on some of the core concepts involved in stockout prevention, let’s take a closer look at how to implement each one into your inventory planning.
Here are a few key steps to help you get started.
1. Deepen your sales forecasting
100% accuracy is impossible in any kind of forecasting. No matter the industry or niche, there are always going to be unforeseen factors that impact your forecast accuracy.
To achieve greater control over your forecasts, data visibility and adjustment of past outliers are the two most crucial ingredients. Because while we don't know the future, we do know the past. Adjusting your past sales and inventory data before running your forecasting calculations can greatly increase their accuracy.
However, for decades, retailers and brands have been relying on manual research, formulas, and analysis to predict future demand. When you have a new product launch coming up, this kind of forecasting can mean digging through hundreds of competitor product reviews, or manually analyzing sales metrics from older, similar product lines in your inventory.
This takes time, and the results aren’t much better than educated guesswork. The right inventory planning technology can help you create sales forecasts faster and more accurately, using a powerful combination of AI and automation.
For example, a inventory planning platform like Flieber can help you:
- Understand existing patterns based on your actual historical sales data
- Group items with similar sales patterns
- Create an initial forecast based on the average sales of items in that cluster or ‘bucket’
- Update the forecast in real time based on the latest sales pattern data from your new product and similar products with similar patterns
Flieber uses AI that helps you understand your sales patterns at the product and portfolio level.
With the ability to rapidly identify key patterns within vast amounts of sales and inventory data, Flieber’s forecasting works even for new products, or those with limited sales history.
2. Sharpen your demand forecasting
Knowing how much of your product the market would be willing to take is every retailer’s holy grail.
However, this is notoriously difficult to predict. It involves data from outside the company, including market trends, competition, and much more. While you can never know exactly how much demand exists in the market, better demand forecasting can get you closer.
Legacy forecasting systems usually rely on manual methods to make future predictions about demand. These can include:
- Historical Data Method: Relies on analyzing years’ worth of company sales data. This method works best if you have a high volume of highly-accurate data.
- Market Research Method: Uses customer surveys and other feedback to make predictions about future purchasing habits.
- Econometric Method: Combines sales data with external factors like customer debt and income.
These methods all have one thing in common: they only let you look at a few variables at a time.
You don’t have the ability to adjust and customize in real-time to account for additional factors and discrepancies that could have a negative impact on your sales.
Flieber’s AI-based forecasts account for a multitude of factors at once, considering previous stockouts, seasonality, outliers, and other variables. Flieber only needs a few months of sales data to make your forecasting up to 40% more accurate.
With machine learning, the more data you feed the system over time, the more it gets to know your business and the more accurate your predictions become.
3. Do more demand planning
Even with strong sales and demand forecasts, there are often external limitations that can impact your ability to stay in stock. That’s why your projections need to protect you against the inevitable crisis moments.
With strong demand planning, you can:
- Reduce warehouse costs: If you’re not overpaying for aging inventory and excess storage, you can free up more working capital to use for other strategic growth projects.
- Optimize your supply chain: With better supply chain visibility, you can root out inefficiencies and diversify your options to keep multiple backup plans in place.
- Improve your customer experience: If your customers learn to rely on you to always have the products they need, they’ll be more forgiving when things don’t go according to plan.
Flieber’s algorithms help you maintain just the right level of inventory, so you’re operating at your leanest and most efficient, without putting your brand at risk of stockout.
4. Elevate your inventory planning
You need to make sure you're getting the right products in the right quantities to the right place at the right time. The more channels you sell on, the more complex and challenging this gets.
Flieber lets you plan your inventory and automatically generate POs, taking into account key details like:
- Forecast scenarios: Various sales and inventory scenarios for a comprehensive demand forecast
- Inventory levels: Including everything you have in stock, across all warehouses, including units in-transit
- Supplier variables: Including MOQs and lead times for different suppliers
Unlike manual or legacy inventory planning solutions, Flieber tells you exactly when and how much to order, and where to send it — across every channel, for every product, in a customizable and intuitive interface.
5. Improve your supply chain operations
For the most robust stockout prevention and profit protection, you need multiple angles of attack. To boost your supply chain operations:
- Build relationships with multiple suppliers: To mitigate the risk of stockouts due to supply chain setbacks, many retailers and brands are switching to a China + 1 strategy, or building partnerships with different suppliers in more than just one country.
- Prepare ahead with safety stock: It’s always good to have some safety stock on hand in case the unexpected happens.
Calculating the right amount of safety stock can be difficult. Get it wrong, and you could find yourself with dead stock and excess storage costs. A better bet is to implement efficient replenishment practices. Flieber is designed to do exactly that.
Master your replenishment and reduce the impact of stockouts
If you’ve ever had a stockout, you know they cost your business much more than just lost sales.
You need a comprehensive, strategic plan to prevent them and the right tools to make faster, better inventory decisions that keep your growth on track.
Flieber does the heavy-lifting for you, forecasting the inventory you need and helping you get it to your warehouses and customers on time. With the money you save on stockout costs, you can invest in growing and scaling your business.
Reduce your stockouts and increase your profits. Get your personalized demo today and learn how Flieber can help.